Revenue Blues: The Case for Higher Taxes
Revenue Blues: The Case for Higher Taxes
There is no conceivable benchmark by which one could sustain the argument that Americans—especially corporations and the wealthy—are taxed too much.
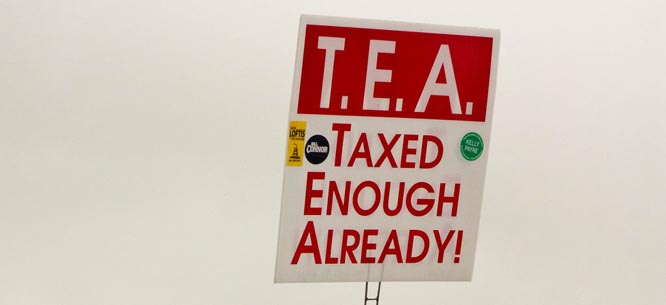
The tempest surrounding the IRS has cemented the view on the right that the American tax system is out of control. We are “taxed enough already,” Tea Partiers complain. When a Senate committee detailed corporate tax-dodging by Apple and others, the most notable response was Rand Paul’s suggestion that the Senate apologize to Apple.
It didn’t use to be this way. From the 1940s into the 1970s, as Beth Pearson points out, taxes were widely understood as essential investments in the public good, and the anti-tax crackpots—at least until the passage of California’s infamous Proposition 13 in 1978—occupied the political fringes. Even Donald Duck happily filed his 1943 return, with any doubts allayed by his understanding and appreciation that “taxes beat the Axis.” Much of the anti-tax rhetoric, of course, serves a “starve the beast” strategy by which diminished revenue yields budget deficits, spending cuts, impoverished public services, and demands for further tax cuts. But that’s not the way the argument is made. Instead we are told that the administration (or “Washington”) has engaged in an unsustainable orgy of taxing and spending.
This couldn’t be farther from the truth. As Dean Baker and others have tirelessly reminded us, the deficit is a creature of the recession (which placed new demands on public programs as it strangled revenues) and not of some willful spending spree. In fact, discretionary government spending, as a share of gross domestic product (GDP), has never been lower.
But the real howler here is on the tax side. There is no conceivable benchmark—in our past, or in comparison to our international peers—by which one could sustain the argument that we are taxed too much, or “taxed enough already.” Here are four ways of underscoring that point.
1.Tax rates are falling, for everyone.
Average household tax rates have fallen, for all income groups, since 1979.This graph, drawing on a recent work by the Congressional Budget Office, includes all federal tax liabilities (income, payroll, excise, business).On the whole, the federal taxes are progressive—high earners pay more, both in absolute dollars and as a share of their income. But no one is paying more in taxes now than they were thirty years ago, or twenty years ago, or ten years ago.

2.Tax rates have fallen dramatically for the very rich.
One of the hallmarks of the postwar compact was a relatively robust redistribution of incomes (and funding of social programs) through the tax system. Since then we have seen a dramatic decline in the top marginal tax rate (see graph below), which climbed steeply in response to the demands of depression and war and was over 90 percent during most of the peak years of postwar growth (1945-1964). The top marginal rate dropped to 70 percent with the Kennedy-Johnson cuts of 1964, to 50 percent (1982) and then 30 percent (1988) under Reagan, climbed back to 40 percent under Clinton, and then was pushed back to 35 percent by the Bush tax cuts.
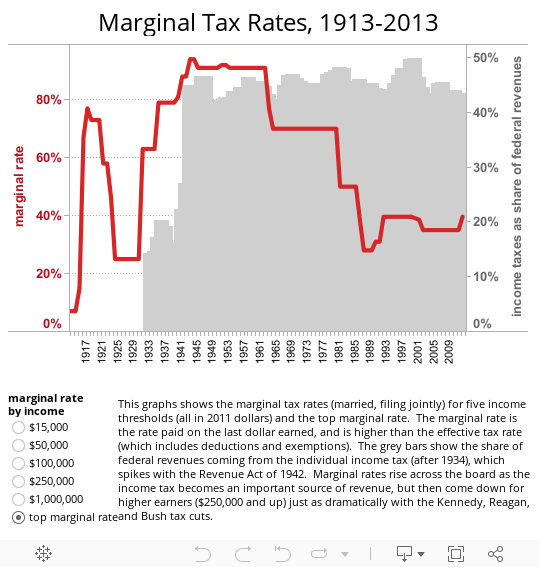
And what do get in return? Across the OECD, inequality is increasing fastest where the top marginal rate has fallen the farthest, and the tax gap may account for as much as 60 percent of difference between upper-end inequality in the United States and upper-end inequality in continental Europe. And, in exchange for diminished revenues and rising inequality, we see none of the benefits that are supposed to follow from unshackling investors and job creators. “Supply-side” cheerleaders have willfully and wildly overestimated the “elasticity” of taxable income—that is, the likelihood that high earners will invest when taxes are low and sit on their hands when taxes are high. Historical and contemporary evidence (see recent work by Christina Romer, Emmanuel Saez and Thomas Piketty, and Andrew Fieldhouse) suggest that there is substantial room to raise rates without triggering any disincentives or lost revenue.
3. Taxes have fallen even more dramatically for business.
Over the last generation, we have also seen a marked shift in the tax burden. Individual income taxes have accounted for between 40 and 50 percent of federal revenues since the end of the Second World War, but over the same span corporate income taxes and payroll taxes have traded places as the next largest contributor. In 1943, corporate income taxes account for 40 percent of federal revenues and payroll taxes about 13 percent. In 2010, corporate income taxes accounted for only 9 percent of federal revenues, while payroll taxes had grown to 40 percent.
The magnitude of this shift—and its implications for inequality—are clear. For much of the postwar era (see graph below), corporate profits represented a declining share of GDP, falling from 12 percent in 1950 to 6 percent in the early 1980s.Over this span, revenue from corporate income taxes fell from about 6 percent to about 3 percent of GDP. But after that, corporate profits rebounded (exceeding 12 percent of GDP just before [2006] and after the recession), while corporate tax receipts continued to slide, bottoming out at 1 percent of GDP in 2009.
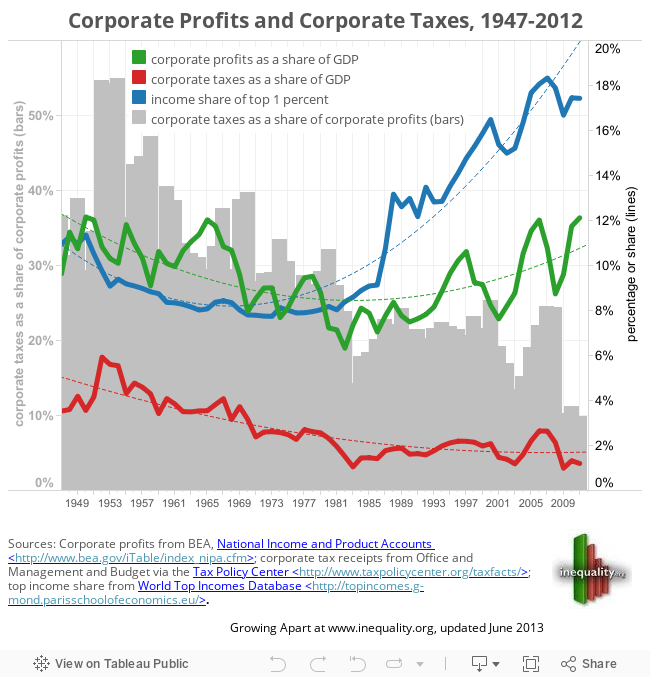
The net result? The corporate tax burden (taxes as a share of profits, the grey bars on the graph) collapsed—from over 50 percent in the mid-1950s, to under 30 percent in the early 1980s, to barely 10 percent in 2010.And the income share of the richest 1 percent (the blue line on the graph) took off. And again, as Thomas Hungerford shows, we get perilously little in return. While lower effective business tax rates have contributed to higher corporate profits, they have not yielded new growth or employment.
4. We don’t collect enough money.
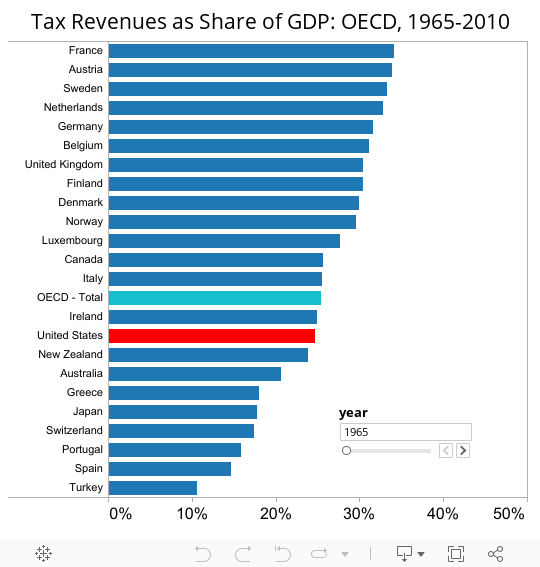
Beyond the distribution of the tax burden (who pays and who doesn’t), an even bigger challenge is its capacity. We simply don’t collect enough revenue to sustain a decent threshold of public goods and public services, or to make much of a dent in the maldistribution of income. Among its OECD peers (see graph below), the United States has one of the lowest rates of taxation as a share of gross national product—and it has moved steadily down this list since the 1970s.
If we look beyond the tax system itself to the net impact of taxes and transfers, the United States is a stark outlier. Across the OECD, taxes and transfers have the net effect of reducing poverty by more than half—from about 25 percent to about 11 percent of households. In the United States, the poverty rate before taxes and transfers is close to the OECD average, but is dampened only slightly (to about 18 percent) by taxes and transfers. The net effect of tax and benefit policies in the United States is to reduce overall inequality by only about 20 percent, one of the lowest rates in the OECD.
Taxed enough? Not by a long shot.
Colin Gordon is a professor of history at the University of Iowa. He writes widely on the history of American public policy and is the author, most recently, of Growing Apart: A Political History of American Inequality, published by the Institute for Policy Studies at www.inequality.org.