
Mapping Our Unequal States
Mapping Our Unequal States
The “suspension bridge” of top income shares (based on the work of Thomas Piketty and colleagues) is by now a familiar icon of American inequality. In this rendering, top-end inequality (measured as the share of national income going to the top 10 or 5 or 1 percent) climbs with the first great industrial and financial fortunes, dips a little in response to the regulatory and tax policies of the World War I era, and climbs again through the roaring 1920s—a decade whose fragile prosperity rested on union-busting at the bottom and tax cuts at the top. From here, the line descends with the “floor” (minimum wage, social security, collective bargaining) and “ceiling” (higher tax rates, financial and securities regulation) policies of the New Deal era, and then begins to climb again in the late 1970s as those polices are slowly and pointedly dismantled.
In a new paper for the Economic Policy Institute, Mark Price and Estelle Sommeiller replicate Piketty’s methodology, using tax data reported by the Internal Revenue Service, for all fifty states. This remarkable work confirms the broad historical trajectory of the national data, but also offers a fascinating glimpse into the variation of that pattern across states and regions. The results are plotted below. For each year, the states (the light blue dots) are plotted by top income shares. The shaded bars represent the middle twenty-five states for every given year, divided into upper- and lower-middle quartiles (lighter and darker grey, respectively) by the median. The remaining states—with the highest and lowest concentrations of wealth—run along the lines above and below the shaded bars.

In broad strokes, the arc of the graph (from Gilded Age to New Deal and back again) echoes the national story. Perhaps more interesting, the policy innovations that dampened national inequality (collective bargaining, retirement and unemployment security, labor standards, financial regulation, progressive taxation) also narrowed the variation across states. In the middle years of the last century, strong federal policies trumped some of the economic and political differences among the states; the erosion of those policies after the late 1970s, in turn, saw both overall inequality and the variation across states widen once again.
The same pattern is evident in the graph below, which uses the same data to plot individual states against the national trends. While less-developed and -populated states in the West and Midwest show less concentration of income at the top in the early decades, the arc of inequality—from state to nation—is remarkably consistent. Again, this is especially true in the middle years of the last century, when strong federal policies trumped (or overcame) the economic and political differences among the states.

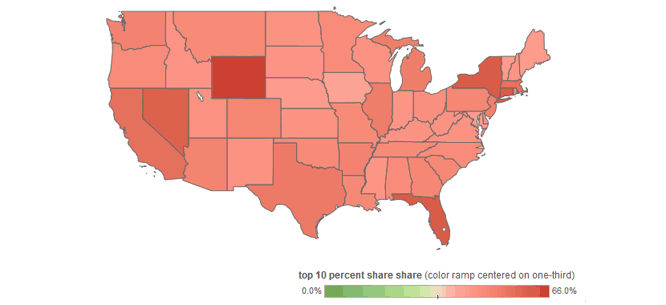
The Price-Sommeiller data teases out important state and regional differences, against a compellingly uniform national drift towards greater inequality. On the map below, the states tip from green to red when the top 10 percent’s share of state income exceeds one-third. In the early years, inequality is starkest in the Northeast. This inequality is generalized by the impact of depression and war in the 1930s and 1940s, but once the policies of the New Deal take hold, inequality eases: by the middle 1950s, only New York and the deep South are still colored red.

The pattern across recent years is just as telling. Of the sixteen states to top the one-third threshold in 1972, the only ones outside the South were the tri-state home of big finance—New York, New Jersey, and Connecticut. As we scroll forward in time from that point, the states in which the top 10 percent claim less than a third of total income begin to disappear—the last in 1988. By 2012, the top 10 percent are claiming over 50 percent of income in eleven states, and over 40 percent in every state.
Colin Gordon is a professor of history at the University of Iowa. He writes widely on the history of American public policy and is the author, most recently, of Growing Apart: A Political History of American Inequality.