Who Pays? Taxes and American Inequality
Who Pays? Taxes and American Inequality
The tax system offers us a detailed and damning description of American inequality and, just as importantly, promises to do something about it. But the American system of public finance has always been weak and fragmented, and three decades’ worth of tax cuts haven’t helped.

This series is adapted from Growing Apart: A Political History of American Inequality, a resource developed for the Project on Inequality and the Common Good at the Institute for Policy Studies and inequality.org. It is presented in nine parts. The introduction laid out the basic dimensions of American inequality and examined some of the usual explanatory suspects. The political explanation for American inequality is developed through chapters looking in turn at labor relations, the minimum wage and labor standards, job-based benefits, social policy, taxes, financialization, executive pay, and macroeconomic policy. Previous installments in this series can be found here.
The tax system offers us a detailed and damning description of American inequality. It is through reporting to the Internal Revenue Service that we are best able to trace the trajectory of top incomes across the full sweep of the last century—an approach pioneered by Thomas Piketty and his colleagues for national top income shares, and recently replicated at the state level by Mark Price and Estelle Sommelier. And, just as importantly, the tax system promises to do something about inequality—by redistributing market rewards directly, or by sustaining other public policies and public goods that shape wages, income, and wealth.
The key issues here (for tax politics and for the relationship between taxes and inequality) are the distribution of the tax burden and the capacity of the tax system to raise revenue. The distributional question, as we look across our own recent history and across the experiences of our international peers, revolves around both the rates at which taxes are paid and the kinds of taxes (sales, income, corporate) that we rely on. The capacity question, in turn, involves not just how much revenue we raise but what we do with it. Who pays and who benefits?
A Short History of American Taxes
Not surprisingly for a country born out of a series of tax revolts, the American system of public finance has always been weak and fragmented. The Constitution granted Congress the power to “lay and collect taxes, duties, imposts, and excises, pay the Debts and provide for the common Defense and general Welfare.” But for its first century, the federal government subsisted on a meager diet of import tariffs, revenue from the sale of public lands, and excise taxes on things like liquor, sugar, and legal documents. More direct taxation was episodic, cobbled together to raise revenues for wars with France (1798) and Britain (1812) and dismantled just as quickly when the emergency had passed.
The first glimmer of the modern tax system came in the 1860s, in response to the immense demands of the Civil War. The Revenue Act of 1861 established a rudimentary income tax (3 percent on annual incomes over $800), and Congress also pushed through a wide array of new excise taxes on everything from playing cards to patent medicines. Concerned that the latter were falling heaviest on those with modest incomes, congressional Republicans pushed for progressive solutions, and in 1862 tweaked the income tax, adding a standard deduction of $600 and a higher marginal rate (5 percent) for incomes over $10,000. But Congress viewed these innovations as emergency war measures and allowed them to lapse in 1872.
Almost immediately, however, the federal government faced a new set of demands—especially as the United States emerged as a world power in the 1890s. A more aggressive and expansionist foreign policy required a more stable fiscal base. At the same time, the push for more open world trade demanded lower tariffs—and, therefore, a way of replacing the revenues that tariffs had generated.
In this recasting of fiscal policy, property taxes (in a still overwhelmingly rural nation) were starkly unpopular, leaving a federal income tax as the last best option. In 1913, the Sixteenth Amendment to the Constitution established the authority for the modern income tax, largely by lifting the constitutional prohibition (Article I, Section 2) against direct federal taxation. The resulting income tax levied a modestly progressive rate, beginning at 1 percent and rising to 7 percent for very high earners (over $500,000).
Exceptional demands—such as war—still drove tax policy, although now Congress managed by tinkering with income tax rates and thresholds rather than inventing and reinventing new revenue streams. With American entry into the First World War imminent, the 1916 Revenue Act raised the lowest tax rate from 1 to 2 percent, raised the top rate to 15 percent on those with incomes over $1.5 million, and imposed new taxes on estates and excess business profits. In 1917, a new 16 percent bracket was created for those earning over $40,000, and the top rate was pushed up to 67 percent. In 1918, the bottom rate was hiked to 6 percent and the top rate to 77 percent. The results were dramatic. Revenues quadrupled and, by 1918, amounted to almost 25 percent of GDP. And the burden was dramatically progressive: only about 15 percent of households paid income taxes, and the richest 1 percent accounted for about 80 percent of total revenues.
The backlash was not long in coming. A postwar boom increased revenues even as the Coolidge, Harding, and Hoover administrations (with the unapologetic plutocrat Andrew Mellon as Secretary of the Treasury throughout) sought to pare back federal responsibilities. Pressed by Mellon (whose 1924 manifesto Taxation: The People’s Business laid out a supply-side argument equating lower taxes with greater revenue), Congress lowered rates five times in the 1920s, eventually bringing the bottom rate back to 1 percent and lowering the top rate to 25 percent. This period also saw the emergence of the perennial anti-taxi lobby—the forerunners of Grover Norquist—as the American Bankers League recast itself as the American Taxpayers League (financed in large part by the Mellon family) and launched a century-long campaign to cut taxes.
For the next generation, however, voices calling to “starve the government” were muted by the exceptional demands of depression and war. When the economy crashed in 1929, the pattern of the early 1920s unspooled in reverse: government revenues fell dramatically (from almost $7 billion in 1920 to under $2 billion in 1932), and Congress pushed income tax rates back up in 1932 and again in 1936.
More importantly, the Social Security Act of 1935 established new payroll taxes (initially set at 2 percent of the first $3,000 in annual wages, to be paid half by the employer and half by the employee). This was both an important new revenue stream and—in some respects—a concession to the American squeamishness about general revenue taxes. Social Security maintained at least the appearance of “social insurance”—in which only contributors enjoyed the benefits. “We put those payroll contributions there so as to give the contributors a legal, moral, and political right to collect their pensions and their unemployment benefits,” as FDR famously argued at the time. “With those taxes in there, no damn politician can ever scrap my social security program.” And, in the bargain, it gave New Deal tax policy a starkly regressive cast—“a system of compulsory payments by the poor for the impoverished,” as one critic put it at the time.
All of this was both cemented and transformed by the economic and fiscal climate of the Second World War. Income tax revenue rebounded with the wartime boom, but still proved woefully insufficient to finance the war effort. The war forged a broad consensus around the need for new revenue (“Taxes to Beat the Axis!”), although some conservatives muttered about resembling Germany and Japan in order to defeat them. The Revenue Act of 1942 dramatically broadened the tax base largely by establishing (following the lead of Social Security) the practice of withholding taxes at the source. Although tax revenues met only about a third of the cost of the war (war bonds and borrowing made up the rest), the income tax system was transformed by the war’s end. As a result of withholding at source and sharply reduced exemptions—taxable incomes of only $500 faced a bottom tax rate of 23 percent—household tax filings grew from 4 million to 43 million. The top marginal rate (incomes over $1 million) went to 94 percent. And federal receipts grew almost fivefold, to over $45 billion in 1945.
The postwar tax system included a steeply progressive income tax, a regressive payroll tax, and a smaller, but growing, range of state (sales and income) and local (property) taxes. Indeed, the thirty years after the war featured both impressive and broadly shared prosperity and high personal and business tax rates—a combination we are now led to believe is impossible. This system was sustained by bipartisan agreement, animated in equal parts by Social Security expansion (including the addition of Medicare in 1965), the national security demands of the Cold War, and the emerging importance of fiscal policy as a tool for managing growth.
Anti-tax activists continued to press for repeal of the Sixteenth Amendment—an effort that fell just two states short of the number needed to call a convention in the early 1950s. Later, as calls for an all-out repeal of the income tax moved to the political margins, the push for dramatic tax cuts—particularly on business and high earners—took center stage. This was part of the broader response to the political and economic crisis of the 1970s, in which the imperatives to shrink government and cut business costs overtook the national agenda. This occurred in state and local settings, where tax revolts (such as California’s “Proposition 13” in 1978) froze tax rates or made it much more difficult for legislatures to raise them. And it spilled into national politics with the election of Ronald Reagan in 1980.
The Reagan Administration (with bipartisan support from Congress) dramatically lowered tax rates, bringing the top marginal income tax rate down to 50 percent (in 1981) and then 28 percent (in 1986), and lowering the corporate tax rate from 50 percent to 35 percent. Some of the progressivity was sustained by also raising personal deduction and exemption thresholds (relieving many low-income Americans of any federal tax liability), but the combination—less revenue from the top and less revenue from the bottom—guaranteed stark budget deficits. The wistful logic of supply-side tax policy—that lower rates would galvanize growth and actually increase revenues—never panned out. But a more cynical “starve the beast” strategy, in which chronic deficits ensured support for future budget cuts, became a staple of fiscal politics.
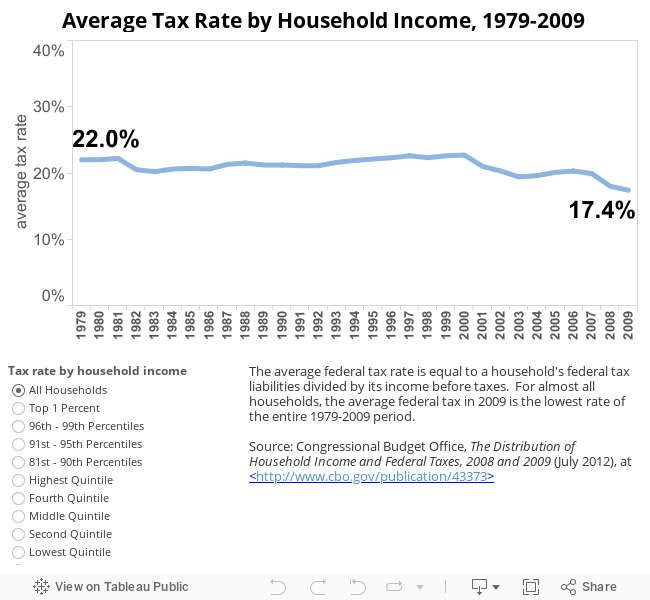
For the next thirty years, federal tax politics fiddled with—but never really challenged—the Reagan-era cuts. The Clinton administration raised rates for those earning more than $250,000 (pushing the top marginal rate to 40 percent), expanded the earned income tax credit, and established a new child tax credit. The Bush tax cuts (2001–3) brought the top marginal rate back down to 35 percent, and slashed taxes on estates, capital gains, and dividends. The consequences were stark: disproportionate gains for the wealthiest Americans, dramatic growth in the federal budget deficit, and little demonstrable new investment or job creation as a result. When the housing market crashed in 2007 and the economy tumbled into recession, the budgetary outlook was already grim, and the curious mythology that Americans were overtaxed [see graphic below] to sustain out-of-control government spending—a staple of Tea Party politics—had taken hold.
American Taxes and American Inequality
How, then, has all of this contributed to growing inequality? Most obvious, of course, is the decline in effective tax rates for the wealthiest Americans. One of the hallmarks of the postwar compact was a relatively robust redistribution of incomes (and funding of social programs) through the tax system. But since then we have seen a dramatic decline in the top marginal tax rate [see graphic below], which was over 90 percent during most of the peak years of postwar growth (1945-1964). The top marginal rate dropped to 70 percent with the Kennedy-Johnson cuts of 1964; to 50 percent (in 1982) and then 30 percent (in 1988) under Reagan; climbed back to 40 percent under Clinton; and then was pushed back to 35 percent by the Bush tax cuts.

The cuts have been even deeper on the taxation of income derived from wealth, such as capital gains and dividends, and the rules are generally lax in allowing the wealthy to shuffle income from one category to the other. Reagan-era tax policy, for example, encouraged the use of stock options rather than salaries to compensate top executives, whose incomes—as a result—began tracking stock values. All of this padded the reward for the small slice of Americans claiming such income. The average tax rate for the richest 400 filers (whose average adjusted gross income comes in at just over $200 million in 2009) fell from over 26 percent in 1992 to under 20 percent in 2009. In other words, those who have realized the lion’s share of income gains over the last generation have also enjoyed the largest tax cuts.
Over the last generation, we have also seen a marked shift in the tax burden [see graphic below]. Individual income taxes have accounted for between 40 and 50 percent of federal revenues since the end of the Second World War. But, over the same span, corporate income taxes and payroll taxes have traded places as the next largest contributor: in 1943, corporate income taxes accounted for 40 percent of federal revenues and payroll taxes about 13 percent. By 2013, corporate income taxes accounted for only 9.9 percent of federal revenues, while payroll taxes had grown to 40 percent.

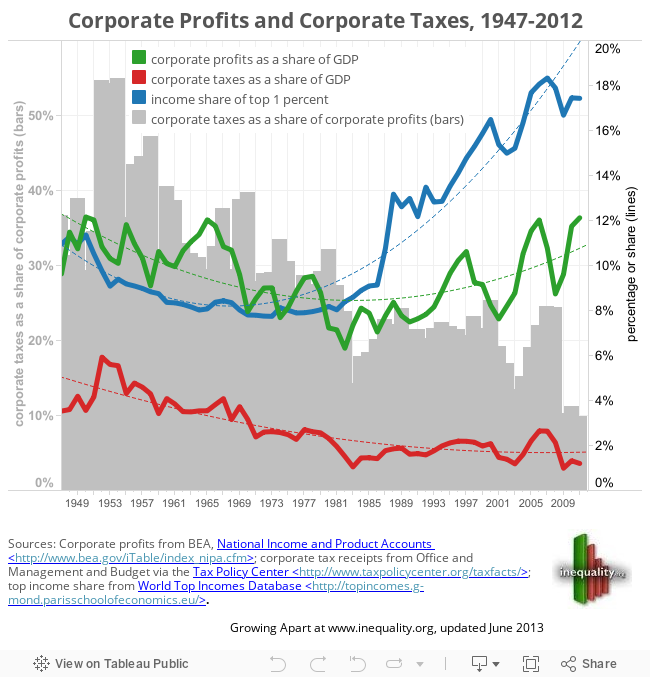
The magnitude of this shift—and its implications for inequality—are clear. For much of the postwar era [see graphic below], corporate profits represented a declining share of gross domestic product (GDP), falling from 12 percent in 1950 to 6 percent in the early 1980s. Over this span, revenue from corporate income taxes fell from about 6 percent to about 3 percent of GDP. But after that, corporate profits rebounded (exceeding 12 percent of GDP just before and just after the recession), and corporate tax receipts continued to slide, bottoming out at 1 percent in 2009. The net result? The corporate tax burden (taxes as a share of profits, the grey bars on the graph below) collapsed—from over 50 percent in the mid-1950s, to less than 30 percent in the early 1980s, to barely 10 percent in 2010. And the income share of the richest 1 percent (the blue line on the graph) took off.
Not only has there been a fundamental shift in the tax burden away from corporate and higher-income tax earners, but the local and payroll taxes that have picked up much of the slack are much more regressive [click here for an interactive map of state tax burdens]. If we factor in the tax and income effects of eligibility for programs like the EITC and Medicaid (means-tested benefits that phase out as income rises), the effective marginal rate is actually steepest for families near the bottom of the income distribution.
The consequences are not just diminished revenues and a shifting burden—but the failure to accrue any of the benefits that were supposed to follow from unshackling investors and job creators. “Supply-side” cheerleaders have willfully and wildly overestimated the “elasticity” of taxable income—that is, the likelihood that high earners will invest when taxes are low and sit on their hands when taxes are high. Historical and contemporary evidence suggest that there is substantial room to raise rates without triggering any demonstrable disincentives, let alone lost revenue.
Indeed, the most common responses to changes in the tax code are short-term and strategic. People and corporations will look for ways to dodge taxes, to shelter income, to move it from one tax year to another (or from one jurisdiction to the next)—but they don’t make real and lasting economic decisions in response to a change in tax rates. This is why, as the Congressional Research Service recently concluded, a generation of tax cuts have done little to spur economic growth (as measured by rates of savings, investment, or productivity growth), but have clearly contributed to the growth of income inequality over the same span.
There is, by the same token, no reason to expect or assume that untaxed income will be reinvested in the United States (if it is invested at all). We know, in the long term, that much of this investment will occur overseas—often to the detriment of American workers and American incomes. We know, in the short term, that investors and corporations are as likely to sit on the cash—or invest it in speculator venues that offer no lasting or “trickle-down” benefit. Indeed, as high incomes are increasingly concentrated in “rent-seeking” finance, there is no reason to assume that the capital unleashed by low taxes will show up down the road as employment or productivity gains at all.
Despite all of this, the federal tax system remains progressive: the post-tax share of income is higher than the pre-tax share for poorer income groups, and the opposite is true for higher income groups; pre-tax inequality is still starker than post-tax inequality. But the changes described above—lower marginal rates on high earners, lower rates in income derived from wealth, the higher share generated by payroll taxes, and the lower share generated by corporate taxes—have undermined that progressivity. Tax policy does much less to moderate inequality today than it did in 1960 or 1980. And more importantly, the modestly progressive structure of federal taxes is essentially flattened by the regressive structure of local and state taxes.
Finally, it’s important to appreciate the broader impact of a tax system that falls so lightly on upper echelon earners. Tax policies ripple through the economy in powerful ways. Tax rules and rates can shape pre-tax income: low marginal rates at the highest brackets, for example, create powerful incentives to inflate executive pay, or may encourage business owners to move earnings from corporate income to personal income (or vice versa when corporate tax rates are low).
Even if raising taxes on the very rich might not, of itself, have much impact on inequality, it would ease a budgetary and revenue crunch that has savaged the kinds of policies and programs (education, unemployment insurance, wage and hour enforcement, public sector bargaining) that do have a profound effect on the distribution of income—a point even ardent supply-siders have conceded. And the persistence of stark inequality and insufficient taxes reinforce one another. Inequality, on its face, heightens the need and demand for redistributive policies. But it also erodes the social and political consensus that makes such policies possible. As a result, polarized societies tend to get mired in short-sighted wars of political attrition, and find it harder to redress inequality or to respond to fiscal crises.
American Taxes in International Perspective
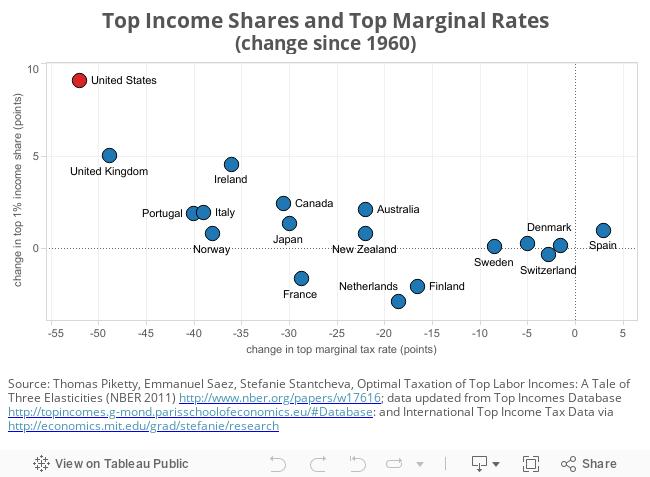
International comparisons only further underscore the relationship between inequality and the American tax system, suggesting that the dramatic ascent of the 1 percent in the United States is largely about taxes (or their absence). Across the OECD, inequality is increasing fastest where the top marginal rate has fallen the farthest [see graphic below], and the tax gap may account for as much as 60 percent of the difference between upper end inequality in the United States and upper end inequality in continental Europe.
The bigger problem is not the structure of the American tax system, but its size. The American tax system (which relies much less on regressive sales taxes than those of its peers) is moderately progressive, but it does little to redress inequality. Fiscal policy in the United States simply doesn’t collect or spend enough money to make much of a dent in the maldistribution of incomes. Among its OECD peers [see graphic below], the United States has one of the lowest rates of taxation (as a share of GDP)—and has moved steadily down this list since the 1970s.

The outlying status of the United States is driven home not just by the relative capacity of the tax system, but by how that money is spent. Across the OECD, as we saw in our survey of social policy, taxes and transfers have the net effect of reducing poverty by more than half—from about 25 percent to about 11 percent of households. In the United States, the poverty rate before taxes and transfers is close to the OECD average, but is dampened only slightly (to about 18 percent) by the combination of tax and social policy. Indeed, the net effect of tax and benefit policies in the United States is to reduce overall inequality by only about 20 percent, one of the lowest rates in the OECD.
Colin Gordon is a professor of history at the University of Iowa. He writes widely on the history of American public policy and is the author, most recently, of Growing Apart: A Political History of American Inequality.
Some of the material in this installment appeared, in a different form, in “Revenue Blues: The Case for Higher Taxes,” Dissent (online), June 2013.
Previous installments of Our Inequality can be found here.